
What we have:
- iOS app for presenting map tiles, compatible with iPhone, iPad, and MacOS – https://apps.apple.com/us/app/sealevels/id1308081355
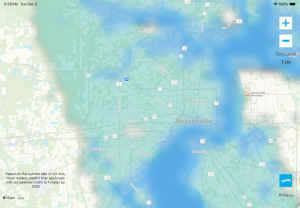
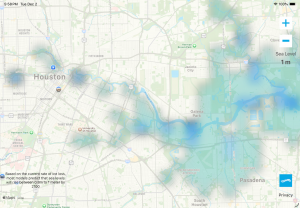
- API running providing map tiles showing sea level rises in 1m increments for zooms up to about 76 m per pixel depending upon the area
- API running showing points of interest in any given area
- API running returning all points of interest by genre
- Barebones of data for points of interest showing the top cities at risk, species at risk in most environmental regions, most glacier locations and most major reef location data, gathered from publicly available sources
- API running allowing for organizations contributing points of interest data to supply links to their existing donation pages
- API running allowing for contributing organizations to link to their existing action and involvement pages, with in-app handling
- An API to provide quizzes and rewards, along with corresponding in-app handling
What we need:
- To finally get around to developing an Android app
- Funding for server running costs
- Increased resolution source data to improve sea level rise display (30cm or better elevation increments, about 10m per pixel, covering the globe)
- Global inland flooding risk data for lakes and rivers
- Fixes to point of interest data to cover more cities, reefs and environmental regions, as well as other environmental items such as landslide prone areas
- Increased quizzes and rewards based on environmental topics
- Publicity planning